Introduction
In quality management, identifying and addressing key problems efficiently is paramount. Among the seven essential quality control (7QC) tools, the Pareto diagram is a powerful method for visualizing the most significant issues from many minor ones. Based on the Pareto principle—often referred to as the 80/20 rule—this tool helps businesses and industries focus on the “vital few” rather than the “trivial many.”
Dr. Kaoru Ishikawa, a pioneer in quality management, emphasized the importance of using statistical tools to drive problem-solving and continuous improvement. The Pareto diagram embodies this philosophy by allowing organisations to prioritise their efforts based on data rather than assumptions.
As we saw about Check Sheet in the previous blog, we will explore the application of the Pareto diagram and how we can benefit from it.
Purpose of Using the Pareto Diagram
The Pareto diagram serves several essential functions in quality control and business decision-making. Here are five key purposes:
- Identifying Major Problems
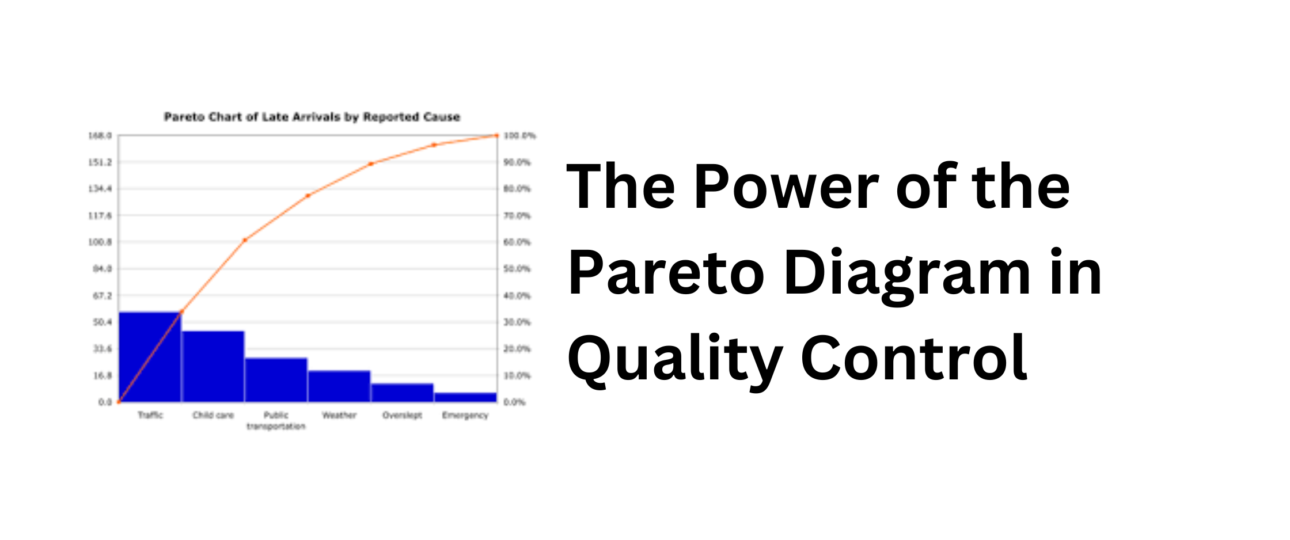
The Pareto diagram visually ranks issues based on their frequency or impact, helping organisations recognize the most critical problems that require immediate attention. - Optimizing Resource Allocation
Since not all problems are equally significant, businesses can allocate their time, workforce, and budget more effectively by focusing on high-priority issues. - Enhancing Decision-Making
By relying on data rather than intuition, managers can make informed decisions regarding process improvements and corrective actions. - Monitoring Progress
As organisations implement solutions, the Pareto diagram can track changes over time, ensuring that corrective actions yield measurable improvements. - Reducing Losses and Improving Quality
Addressing the primary causes of defects or inefficiencies leads to overall improvement in quality, customer satisfaction, and cost reduction.
Scope of the Pareto Diagram
The Pareto diagram is widely applicable across industries and disciplines, including:
- Manufacturing: identifying the most common defects in products.
- Customer Service: Prioritising frequent customer grievances.
- Supply Chain Management: Addressing delays and inefficiencies.
- Software Development: Recognizing recurring bugs or system failures.
- Finance: pinpointing major sources of revenue loss or fraud.
Regardless of the field, the Pareto diagram is an invaluable tool for identifying and addressing critical issues systematically.
Now that we have seen the concept of the Pareto diagram, let’s explore a real-world success story that showcases its transformative impact when applied effectively.
Toyota and Pareto Diagram in TQM
One well-known company that effectively uses Pareto diagrams for TQM is Toyota. As a leader in manufacturing and quality control, Toyota applies this tool as part of its Toyota Production System (TPS) and lean manufacturing practices.
How Toyota Implements Pareto Diagrams
- Defect Analysis: Toyota uses Pareto charts to identify the most frequent defects in car production. By analysing defects reported in different production lines, they determine which problems need immediate attention.
- Supplier Quality Control: The company examines defect rates from different suppliers, helping them focus on the top 20% of suppliers causing 80% of issues.
- Customer Complaints Handling: Toyota prioritises customer complaints using Pareto analysis. If 80% of complaints come from a small number of causes (e.g., engine failure, brake issues), they focus on solving those high-impact problems first.
- Production Efficiency Improvement: Toyota analyses machine breakdown data using Pareto diagrams to identify and resolve the most common failures affecting production lines.
Benefits Toyota Gained from Using Pareto Diagrams
- Reduction in Defect Rates: By focusing on the most significant defect sources, Toyota improved production quality and reduced the cost of rework.
- Enhanced customer satisfaction: prioritising major customer complaints led to increased brand loyalty and reduced warranty claims.
- Efficient Resource Allocation: Toyota focused its improvement efforts on areas that delivered the most significant impact, optimizing time, labor, and costs.
- Higher Productivity: By addressing the most frequent production bottlenecks, Toyota improved efficiency and minimized downtime.
As we’ve seen in Toyota’s successful implementation of the Pareto Diagram, this powerful tool can drive significant improvements in quality control and operational efficiency. Gain its benefits by learning how to use and manage Pareto analysis effectively.
To explore how the Pareto diagram enhances quality control, learn how to create and interpret it, and gain insights into its practical applications, read Twenty Tools, equip yourself with the knowledge, implement the strategy, and unlock new opportunities for efficiency and profitability.
Other Companies Using Pareto Diagrams
- Ford uses Pareto analysis to reduce defects in car assembly lines.
- General Electric (GE) applied Pareto principles in its Six Sigma initiatives to improve process quality.
- Coca-Cola uses Pareto Diagrams to analyse customer complaints and production issues.
- IBM uses the tool in software development to identify the most common coding errors affecting performance.
Conclusion
The Pareto diagram is an indispensable tool in quality management and decision-making. By helping organisations identify and focus on the most significant problems, it ensures efficient resource utilization and continuous improvement. Businesses that implement Pareto analysis from manufacturing to finance and beyond can enhance productivity, reduce losses, and improve customer satisfaction.
Would you like to explore other quality control tools? Stay tuned for our next blog on cause-and-effect diagrams and their role! Know more about the Pareto diagram and other tools in Total Quality Management from Twenty Tools.
GET IN TOUCH

2 Comments
I want to get this type of value added updates on mail
We’re glad to hear this, sir! We truly appreciate your interest, and we’re happy to keep you updated. Going forward, you will receive all upcoming mails on our blogs directly via email.
If you have any specific preferences or queries, feel free to reach out.